Home | About | Data scientists Interviews | For beginners | Join us

Introduction to Linear Regression:
Linear Regression means predicting scores of one variable from the scores of second variable. The variable we are predicting is called the criterion variable and is referred to as Y. The variable we are basing our predictions is called the predictor variable and is referred to as X. When there is only one predictor variable, the prediction method is called simple regression.The aim of linear regression is to finding the best-fitting straight line through the points. The best-fitting line is called a regression line.
![Image [7]](https://dataaspirant.wordpress.com/wp-content/uploads/2014/09/image-7.png)
The above equation is hypothesis equation
where:
hθ(x) is nothing but the value Y(which we are going to predicate ) for particular x ( means Y is a linear function of x)
θ0 is a constant
θ1 is the regression coefficient
X is value of the independent variable
Properties of the Linear Regression Line
Linear Regression line has the following properties:
- The line minimizes the sum of squared differences between observed values (the y values) and predicted values (the hθ(x) values computed from the regression equation).
- The regression line passes through the mean of the X values (x) and through the mean of the Y values ( hθ(x) ).
- The regression constant (θ0) is equal to the y intercept of the regression line.
- The regression coefficient (θ1) is the average change in the dependent variable (Y) for a 1-unit change in the independent variable (X). It is the slope of the regression line.
The least squares regression line is the only straight line that has all of these properties.
Goal of Hypothesis Function
Goal of Hypothesis is to choose θ0 and θ1 , so that hθ(x) is close to Y for our training data,while choosing θ0 and θ1 we have to consider the cost function( J(θ) ) where we are getting low value for cost function( J(θ) ).
The below function is called as cost function, cost function ( J(θ) ) is nothing but just a Squared error function.

Let’s Understand Linear Regression with Example
Before going to explain linear Regression let me summarize the things we learn


Suppose we have data some thing look’s like this
| No. | Year | Population |
|---|---|---|
| 1 | 2000 | 1,014,004,000 |
| 2 | 2001 | 1,029,991,000 |
| 3 | 2002 | 1,045,845,000 |
| 4 | 2003 | 1,049,700,000 |
| 5 | 2004 | 1,065,071,000 |
| 6 | 2005 | 1,080,264,000 |
| 7 | 2006 | 1,095,352,000 |
| 8 | 2007 | 1,129,866,000 |
| 9 | 2008 | 1,147,996,000 |
| 10 | 2009 | 1,166,079,000 |
| 11 | 2010 | 1,173,108,000 |
| 12 | 2011 | 1,189,173,000 |
| 13 | 2012 | 1,205,074,000 |
Now our task is to answer the below questions
| No. | Year | Population |
|---|---|---|
| 1 | 2014 | ? |
| 2 | ? | 2,205,074,000 |
Let me draw a graph for our data
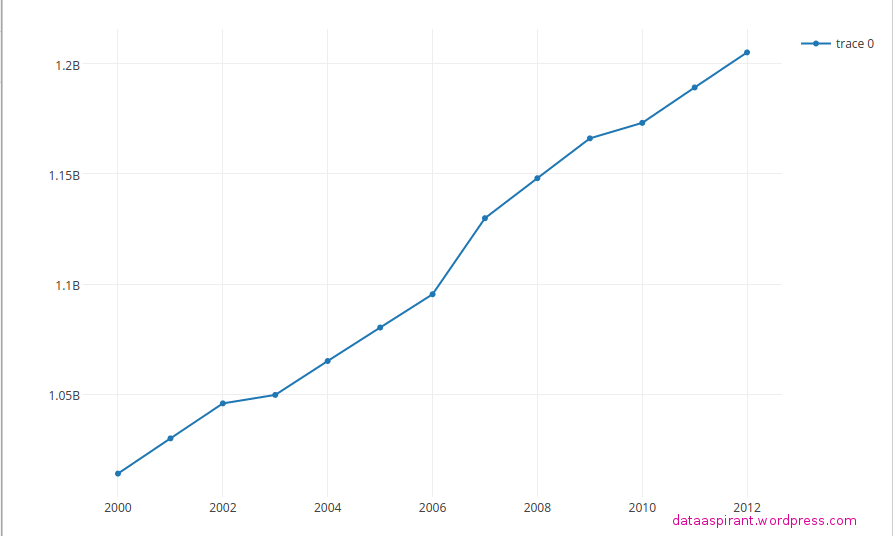
Python Code for graph
# Required Packages

import plotly.plotly as pyfrom plotly.graph_objs import *

py.sign_in("username", "API_authentication_code")

from datetime import datetime

x = [

datetime(year=2000,month=1,day=1),
datetime(year=2001,month=1,day=1),
datetime(year=2002,month=1,day=1),
datetime(year=2003,month=1,day=1),
datetime(year=2004,month=1,day=1),
datetime(year=2005,month=1,day=1),
datetime(year=2006,month=1,day=1),
datetime(year=2007,month=1,day=1),
datetime(year=2008,month=1,day=1),
datetime(year=2009,month=1,day=1),
datetime(year=2010,month=1,day=1),
datetime(year=2011,month=1,day=1),
datetime(year=2012,month=1,day=1)
]

data = Data([

Scatter(

x = x,

y = [

1014004000,

1029991000,

1045845000,

1049700000,

1065071000,

1080264000,

1095352000,

1129866000,

1147996000,

1166079000,

1173108000,

1189173000,

1205074000]

)

])

plot_url = py.plot(data, filename='DataAspirant')
- Now what we will do is we will find the most suitable value for our θ0 and θ1 using hypotheses equation.
- Where x is nothing but the years , and the hθ(X) is the prediction value for our hypotheses .
- Once we done finding θ0 and θ1 we can find any value.
- Keep in mind we fist find the θ0 and θ1 for our training data.
- Later we will use these θ0 and θ1 values to do prediction for test data.
Don’t think too much about how to find θ0 and θ1 values, in coming posts i will explain how we can find θ0 and θ1 values with nice example and i will explain the coding part too.
Follow us:
FACEBOOK| QUORA |TWITTER| REDDIT | FLIPBOARD | MEDIUM | GITHUB
I hope you liked todays post. If you have any questions then feel free to comment below. If you want me to write on one specific topic then do tell it to me in the comments below.


[…] With linear regression, we know that we have to find a linearity within the data so we can get θ0 and θ1 […]
LikeLike
[…] the packages in this post python packages for datamining. It would better once your go through Linear Regression […]
LikeLike